


If you know two points that fall on a particular exponential curve, you can define the curve by solving the general exponential function using those points. In practice, this means substituting the points for y and x in the equation y = abx. The procedure is easier if the x-value for one of the points is 0, which means the point is on the y-axis. If neither point has a zero x-value, the process for solving for x and y is a tad more complicated. Show
Why Exponential Functions Are ImportantMany important systems follow exponential patterns of growth and decay. For example, the number of bacteria in a colony usually increases exponentially, and ambient radiation in the atmosphere following a nuclear event usually decreases exponentially. By taking data and plotting a curve, scientists are in a better position to make predictions. From a Pair of Points to a GraphAny point on a two-dimensional graph can be represented by two numbers, which are usually written in the in the form (x, y), where x defines the horizontal distance from the origin and y represents the vertical distance. For example, the point (2, 3) is two units to the right of the y-axis and three units above the x-axis. On the other hand, the point (-2, -3) is two units to the left of the y-axis. and three units below the x-axis. If you have two points, (x1, y1) and (x2, y2), you can define the exponential function that passes through these points by substituting them in the equation y = abx and solving for a and b. In general, you have to solve this pair of equations: y1 = abx1 and y2 = abx2, . In this form, the math looks a little complicated, but it looks less so after you have done a few examples. One Point on the X-axisIf one of the x-values -- say x1 -- is 0, the operation becomes very simple. For example, solving the equation for the points (0, 2) and (2, 4) yields: 2 = ab0 and 4 = ab2. Since we know that b0 = 1, the first equation becomes 2 = a. Substituting a in the second equation yields 4 = 2b2, which we simplify to b2 = 2, or b = square root of 2, which equals approximately 1.41. The defining function is then y = 2 (1.41)x. Neither Point on the X-axisIf neither x-value is zero, solving the pair of equations is slightly more cumbersome. Henochmath walks us through an easy example to clarify this procedure. In his example, he chose the pair of points (2, 3) and (4, 27). This yields the following pair of equations: 27 = ab4 3 = ab2 If you divide the first equation by the second, you get 9 = b2 so b = 3. It's possible for b to also be equal to -3, but in this case, assume it's positive. You can substitute this value for b in either equation to get a. It's easier to use the second equation, so: 3 = a(3)2 which can be simplified to 3 = a9, a = 3/9 or 1/3. The equation that passes through these points can be written as y = 1/3(3)x. An Example from the Real WorldSince 1910, human population growth has been exponential, and by plotting a growth curve, scientists are in a better position to predict and plan for the future. In 1910, the world population was 1.75 billion, and in 2010, it was 6.87 billion. Taking 1910 as the starting point, this gives the pair of points (0, 1.75) and (100, 6.87). Because the x-value of the first point is zero, we can easily find a. 1.75 = ab0 or a = 1.75. Plugging this value, along with those of the second point, into the general exponential equation produces 6.87 = 1.75b100, which gives the value of b as the hundredth root of 6.87/1.75 or 3.93. So the equation becomes y = 1.75 (hundredth root of 3.93)x. Although it takes more than a slide rule to do it, scientists can use this equation to project future population numbers to help politicians in the present to create appropriate policies. Learning Outcomes
In the previous examples, we were given an exponential function which we then evaluated for a given input. Sometimes we are given information about an exponential function without knowing the function explicitly. We must use the information to first write the form of the function, determine the constants a and b, and evaluate the function. How To: Given two data points, write an exponential model
Example: Writing an Exponential Model When the Initial Value Is KnownIn 2006, 80 deer were introduced into a wildlife refuge. By 2012, the population had grown to 180 deer. The population was growing exponentially. Write an algebraic function N(t) representing the population N of deer over time t. Try ItA wolf population is growing exponentially. In 2011, 129 wolves were counted. By 2013 the population had reached 236 wolves. What two points can be used to derive an exponential equation modeling this situation? Write the equation representing the population N of wolves over time t. Example: Writing an Exponential Model When the Initial Value is Not KnownFind an exponential function that passes through the points [latex]\left(-2,6\right)[/latex] and [latex]\left(2,1\right)[/latex].
Try ItGiven the two points [latex]\left(1,3\right)[/latex] and [latex]\left(2,4.5\right)[/latex], find the equation of the exponential function that passes through these two points. Q & ADo two points always determine a unique exponential function? Yes, provided the two points are either both above the x-axis or both below the x-axis and have different x-coordinates. But keep in mind that we also need to know that the graph is, in fact, an exponential function. Not every graph that looks exponential really is exponential. We need to know the graph is based on a model that shows the same percent growth with each unit increase in x, which in many real world cases involves time. How To: Given the graph of an exponential function, write its equation
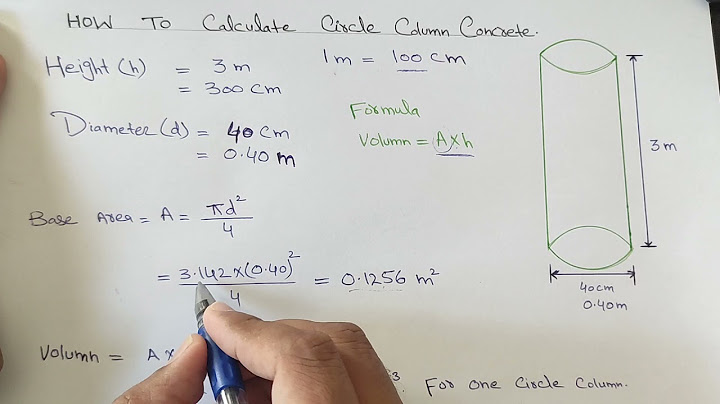
Example: Writing an Exponential Function Given Its GraphFind an equation for the exponential function graphed below.  Try ItFind an equation for the exponential function graphed below. Investigating Continuous GrowthSo far we have worked with rational bases for exponential functions. For most real-world phenomena, however, e is used as the base for exponential functions. Exponential models that use e as the base are called continuous growth or decay models. We see these models in finance, computer science, and most of the sciences such as physics, toxicology, and fluid dynamics. A General Note: The Continuous Growth/Decay FormulaFor all real numbers t, and all positive numbers a and r, continuous growth or decay is represented by the formula [latex]A\left(t\right)=a{e}^{rt}[/latex] where
If r > 0, then the formula represents continuous growth. If r < 0, then the formula represents continuous decay. For business applications, the continuous growth formula is called the continuous compounding formula and takes the form [latex]A\left(t\right)=P{e}^{rt}[/latex] where
How To: Given the initial value, rate of growth or decay, and time t, solve a continuous growth or decay function
Example: Calculating Continuous GrowthA person invested $1,000 in an account earning a nominal interest rate of 10% per year compounded continuously. How much was in the account at the end of one year? Try ItA person invests $100,000 at a nominal 12% interest per year compounded continuously. What will be the value of the investment in 30 years? Example: Calculating Continuous DecayRadon-222 decays at a continuous rate of 17.3% per day. How much will 100 mg of Radon-222 decay to in 3 days? Try ItUsing the data in the previous example, how much radon-222 will remain after one year? Contribute!Did you have an idea for improving this content? We’d love your input. Improve this pageLearn More How do you find the exponential function given two points?If you have two points, (x1, y1) and (x2, y2), you can define the exponential function that passes through these points by substituting them in the equation y = abx and solving for a and b. In general, you have to solve this pair of equations: y1 = abx1 and y2 = abx2, .
How do you find the exponential function on a calculator?On most graphing calculators your exponent key is the caret top key: ^.
|

Find the exponential function given two points calculator
Related Posts


Copyright © 2024 en.ketajaman Inc.